PT Asset Management, LLC

Muni Prism

June, 2026

Boring but Durable: The Credit Characteristics that Set GO Bonds Apart

Introduction

Perceptions of General Obligation (GO) bonds may have shifted over the past two decades following several high profile municipal and state bankruptcies including the City of Detroit (2013) and Puerto Rico Complex (2016-2017) credit events. However, default rates remain very low. The most recent available Moody’s data indicates an improved median fiscal position for state and local governments. State debt declined by 2.6% in 2024, while debt as a percentage of total revenue fell to 23.0%, a decrease of 0.7%.1 For cities, long-term liabilities (including debt and pensions) declined to 182.2% of total revenue, down from 220.0% despite a rise in debt (counties: 124.9%, down from 160.7%).2 Post COVID-19, fiscal stability among state and local governments has been partly supported by federal stimulus, as well as strong tax collections (property, sales, and income taxes). Looking ahead, the economic cycle is likely to moderate, which could weaken tax revenue, but higher levels of borrowing are expected as states and local borrowers ramp up infrastructure investments after a period of deferred capital spending.3 Simultaneously, borrowers find themselves in a period of federal retrenchment that may require states and local government to shoulder a larger share of spending on healthcare, infrastructure, and climate-related priorities. This paper aims to demonstrate to investors why municipal GO credit is still considered among the most resilient segments of the fixed-income market in the context of additional borrowing.

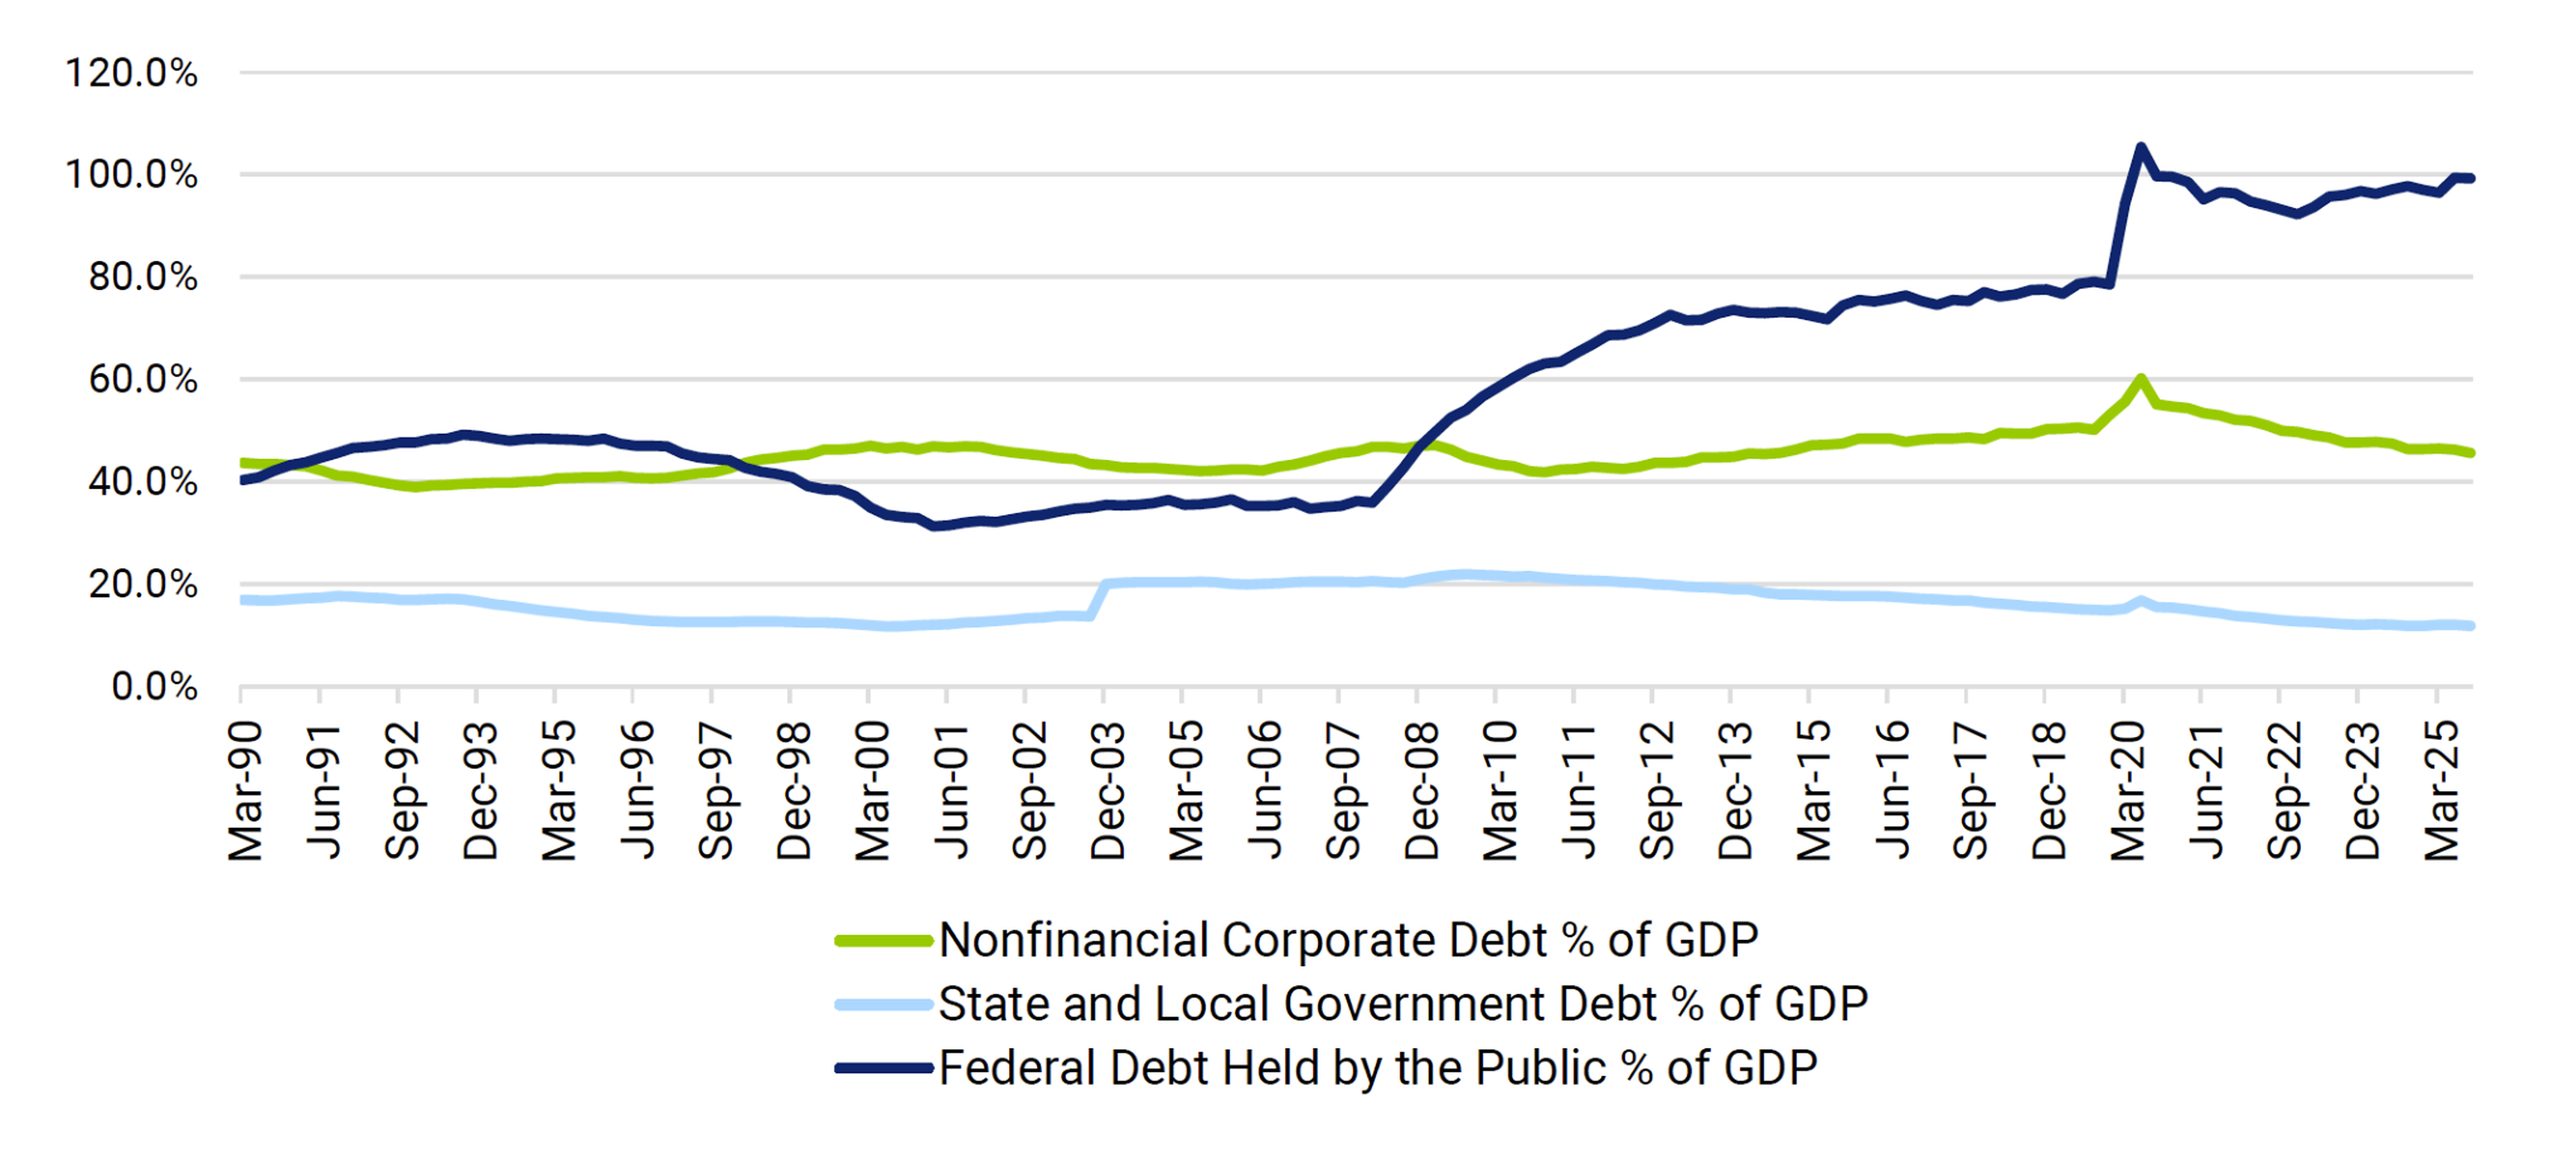
Exhibit 1: Debt Outstanding as % of US GDP

Source: Federal Reserve Bank of St. Louis as of September 30th, 2025.

What is a General Obligation (GO) bond?

A general obligation bond or GO is debt issued by a governmental organization such as a State, City, County, or School District to fund its capital improvement projects essential to everyday use by Americans. Examples include school construction, road and expressway maintenance, public safety, parks and bridges. A GO is typically secured by the full faith, credit and general taxing power of the issuer.4

Local Government General Obligation Bonds

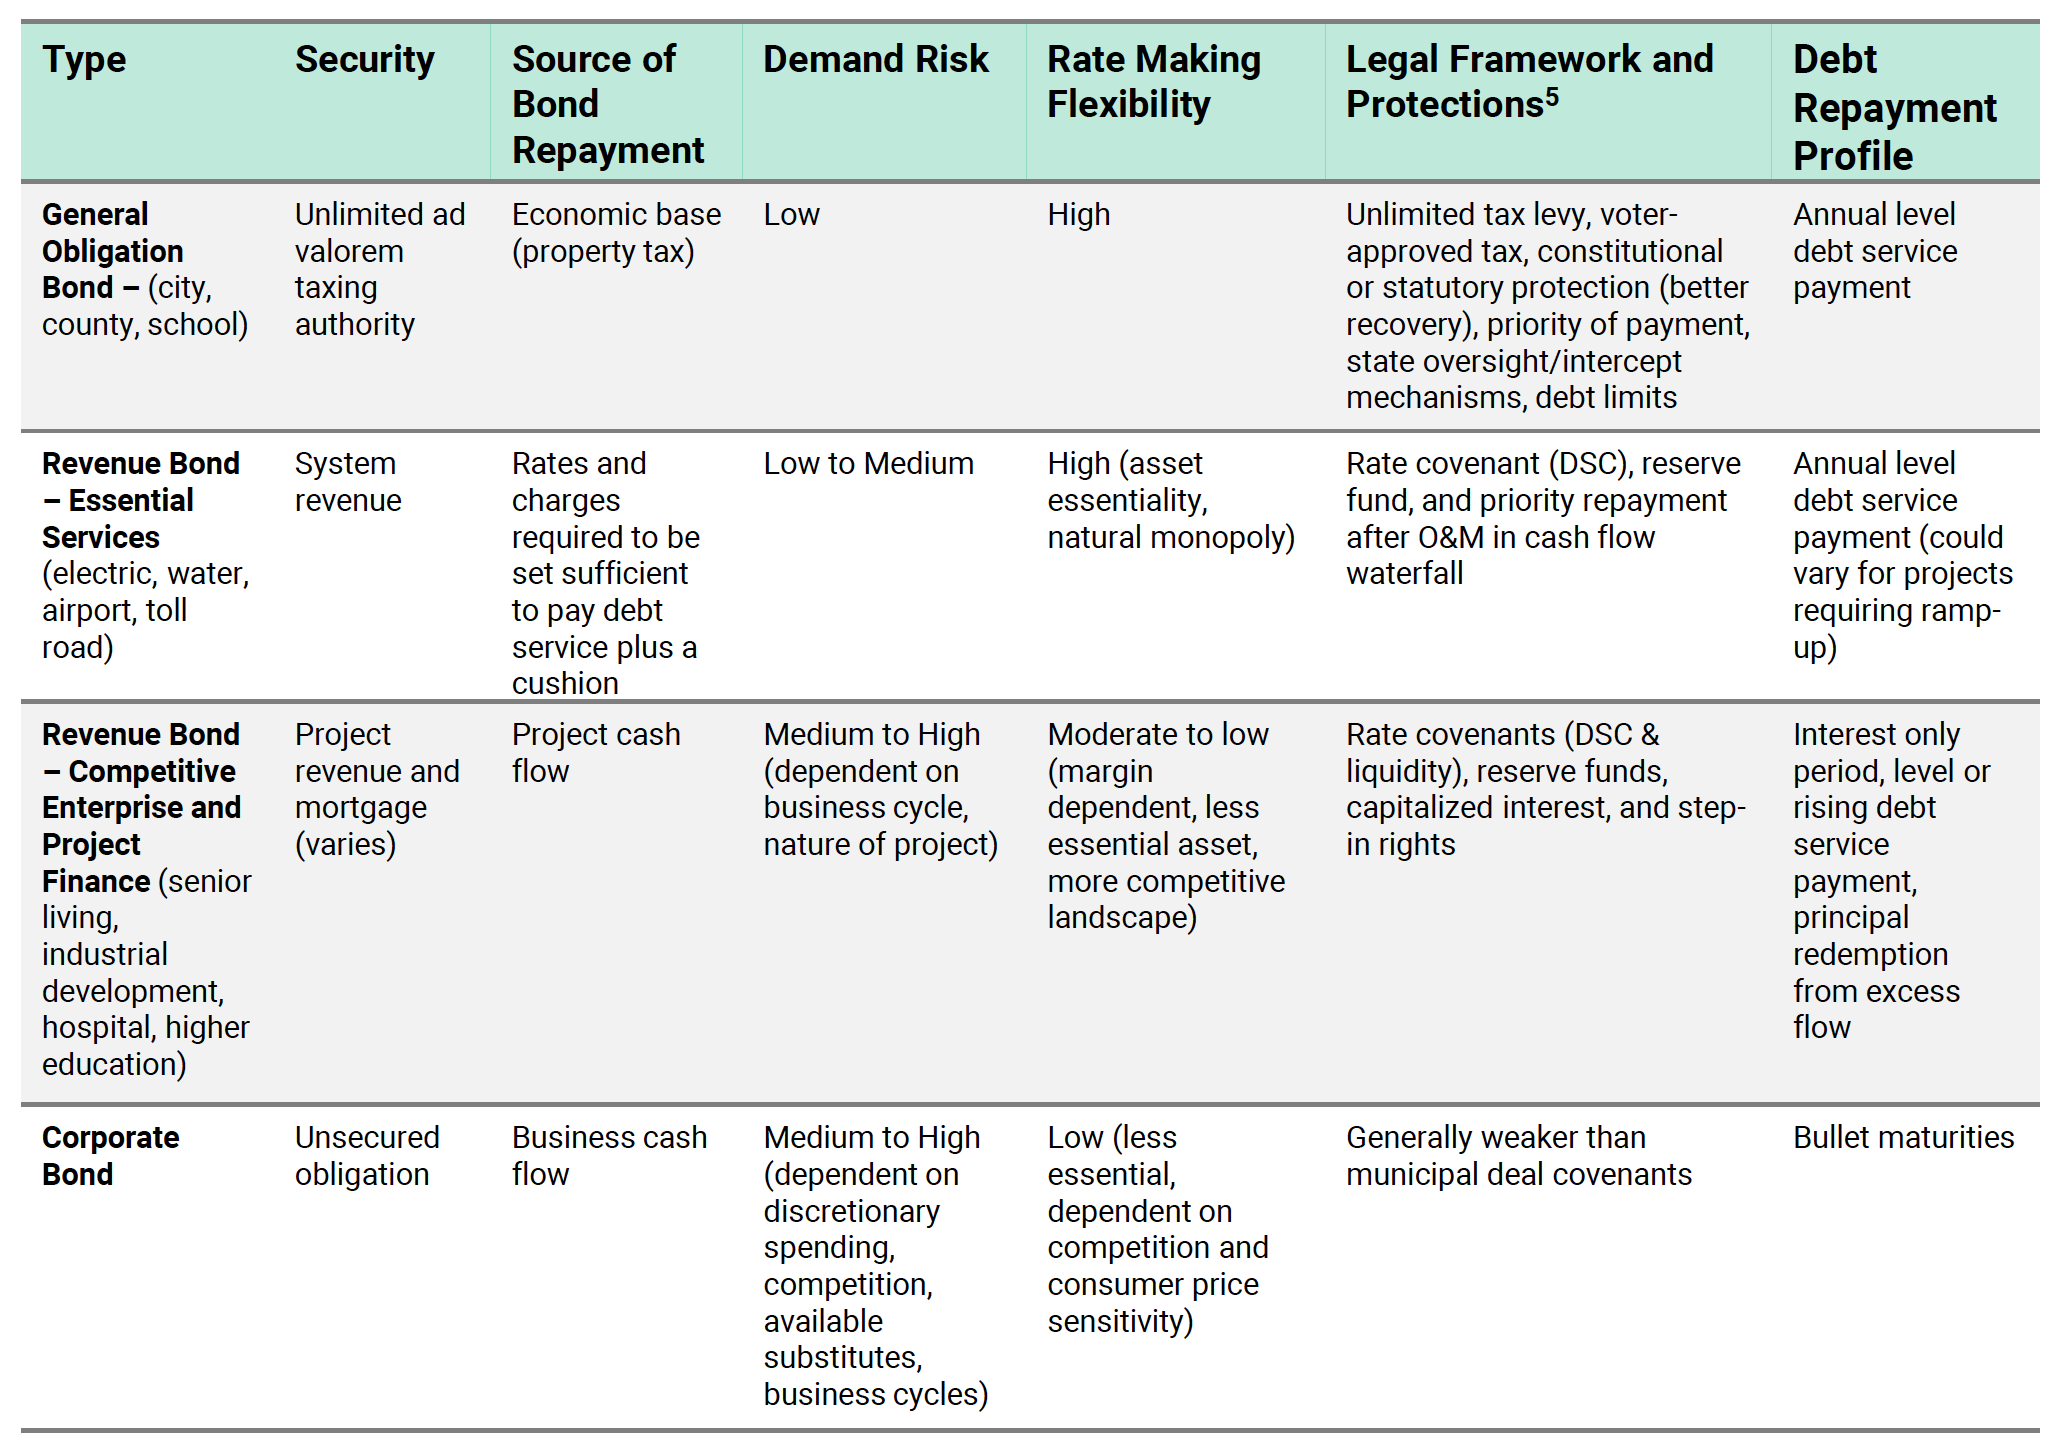
The strongest and most common form of a local GO is the unlimited taxable general obligation (ULTGO) bond which is backed by an uncapped property tax levy. What differentiates a local GO bond from other municipal bond types (such as revenue bonds), and corporate bonds, is the legally enforceable obligation to make principal and interest payments when due. A city, county, or school district will fulfill this obligation through its taxing authority. The taxing power given to the local government by the state, the enforceability of this power through legal frameworks (either statutes or constitution), together with the broad tax base that taxes are derived from, puts GOULTs among the stronger and more stable forms of fixed income credit.

Exhibit 2: Comparison of the Most Common Municipal Bond Types

Other types of GOs include GO unsecured bonds, backed by the borrower’s general fund and General Obligation Limited Tax (GOLT) bonds backed by limited taxes. Credit quality among GOs can varywidely depending on factors including tax pledge, strength and breadth of tax base, taxing capacity, debt burden, health of fund balances, and management practices.

Credit Quality Distribution and Default Rates

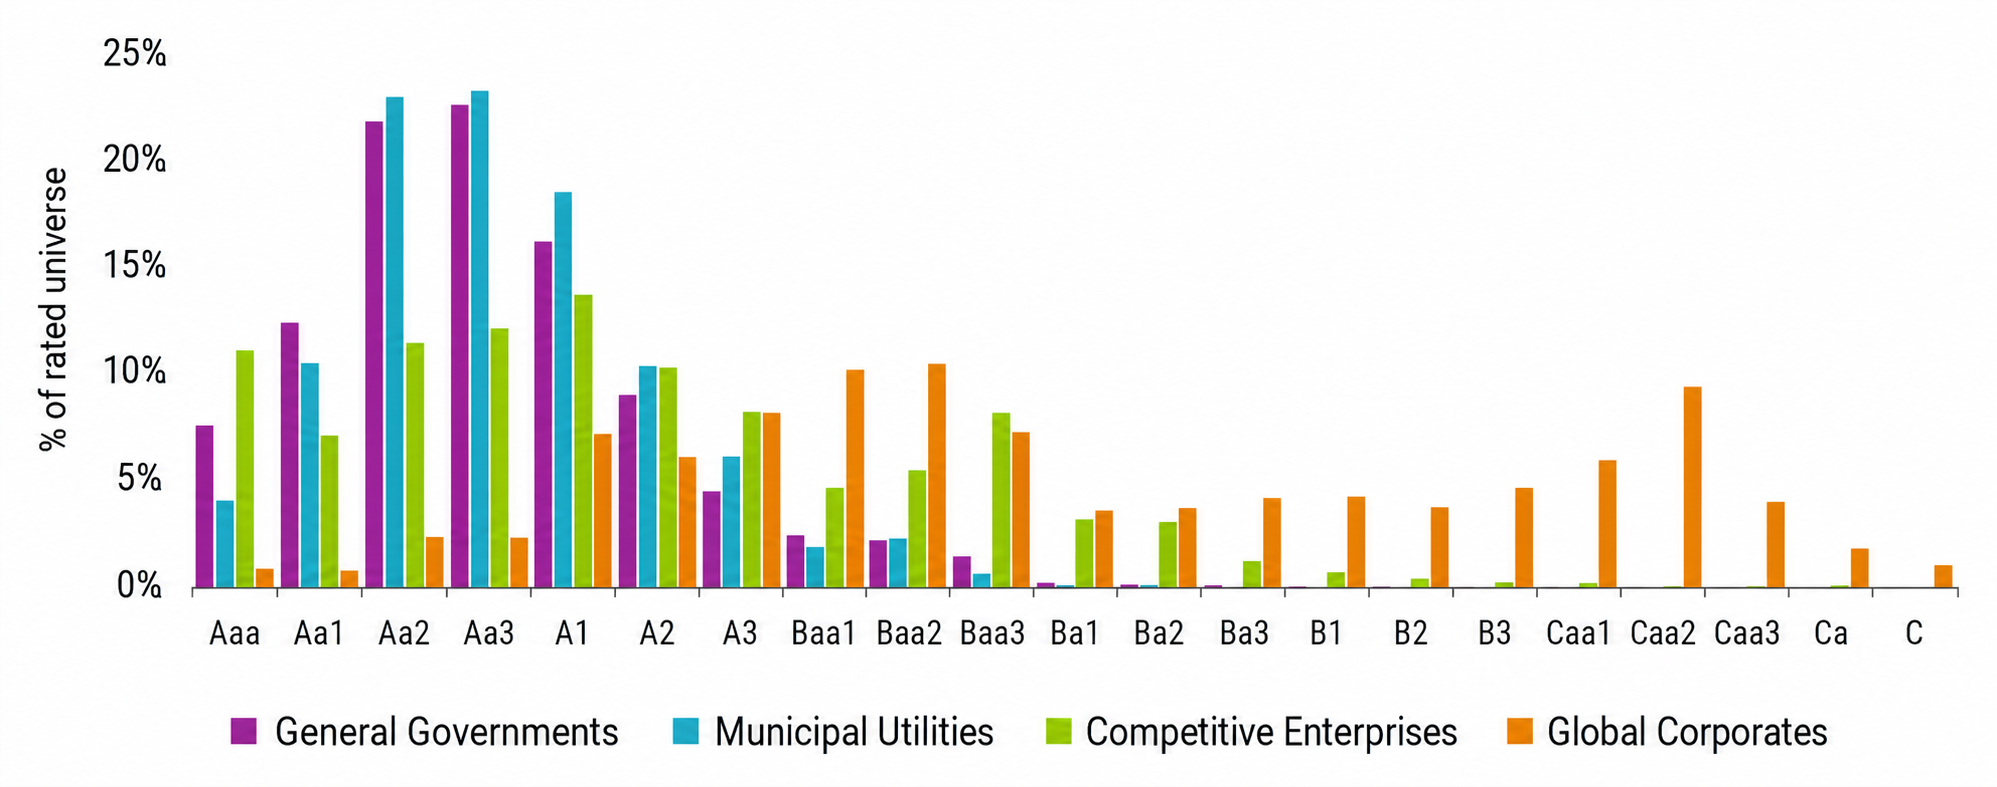
  • Municipal bond rating quality tends to be skewed towards the higher end of the rating spectrum with a median rating of Aa3 (all rated municipals) which includes general government (Aa3), municipal utilities (Aa3), and competitive enterprises (A1) in contrast to the corporate bond median rating of Baa3.6
  • About 41.4% (or 3,728) of GO issuers are rated Aa2 or higher, compared to 37.3% (or 621) for municipal utilities, and 29.3% (or 453) competitive enterprises. Across the same rating categories, corporates account for only 3.76% of total rated issuers.7
  • Average recovery on rated municipal bonds is 65.0% compared to 47.0% for a senior unsecured global corporate bond. Recovery rates vary within the municipal universe and may be unpredictable and are dependent on strength of claim, liquidation, and whether they compete with pensions.8
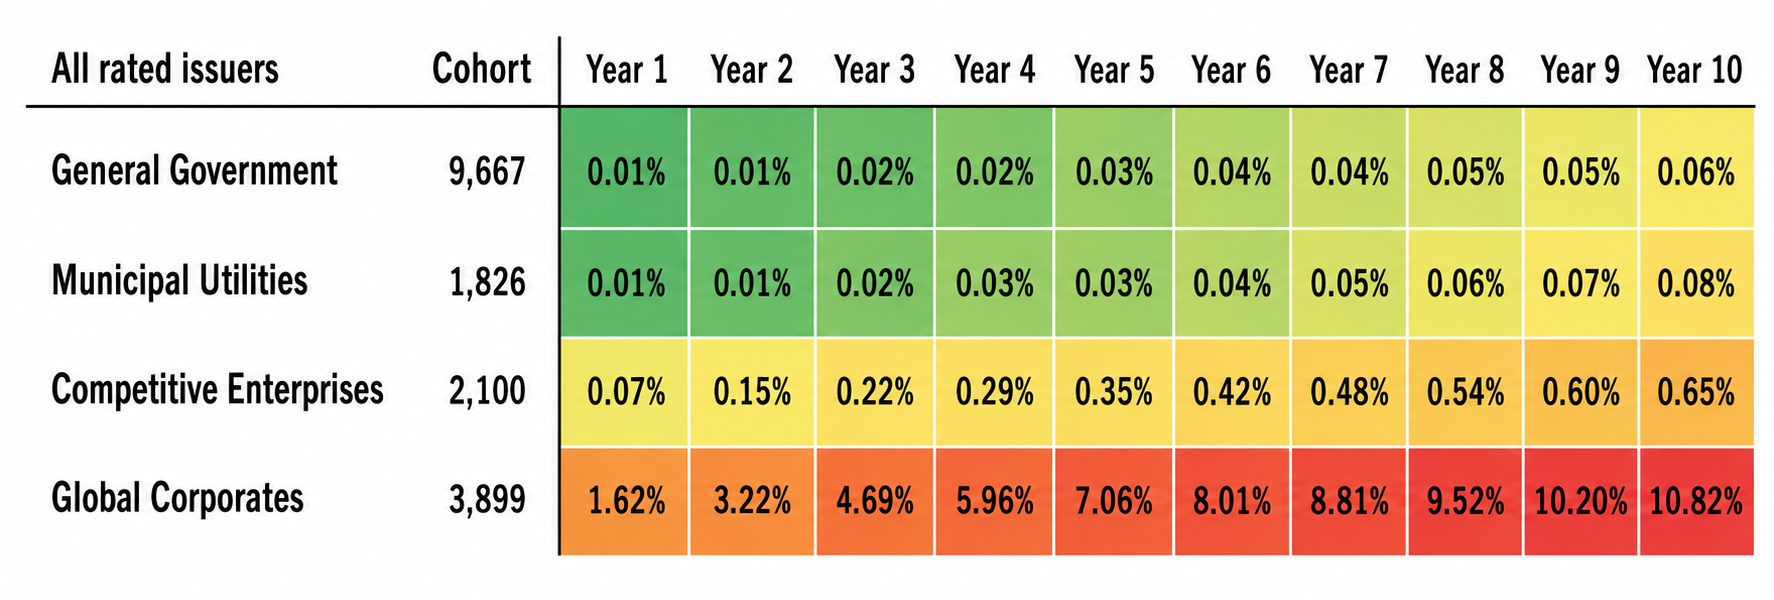
  • As of the end of 2024, the number of municipal defaults since 1970 totaled 117 ($72.2 billion) of which $59.0 bn was related to the Puerto Rico defaults between 2015 and 2017.9 To put default volume into perspective, the size of the municipal bond market (debt outstanding) as of Q4 2025 was $4.4 trillion.10 Municipal cumulative default rates since 2015 (after a five year period) are still low at 0.05% compared to 8.3% for corporates.

Exhibit 3: Default Rates over the Period 1970-2024: Municipal Issuers and Global Corporates

Source: Moody’s Rating as of August 4th, 2025.

Exhibit 4: Rating Distribution: Municipal Issuers and Global Corporates

Source: Moody’s Rating as of August 4th, 2025.

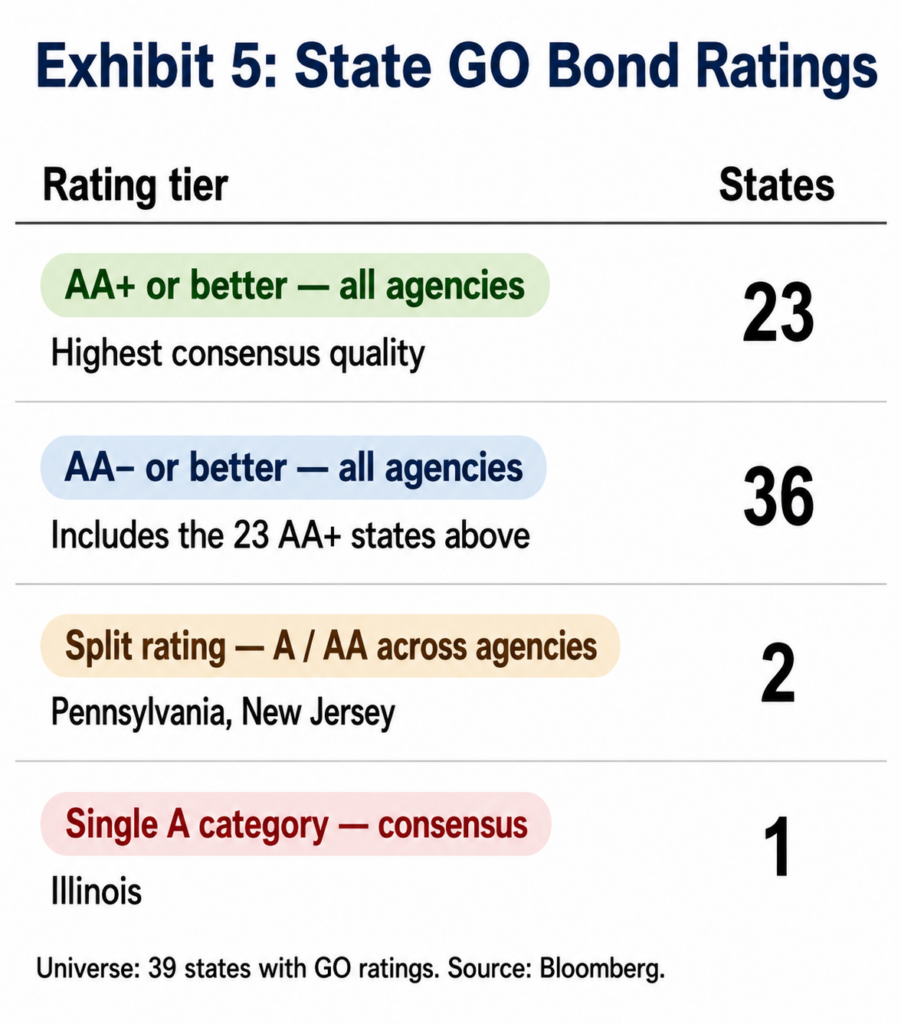
State General Obligation Bonds11

Historically, state GOs, at the median, are considered relatively more stable than other municipal sectors because of the structural underpinnings which include budgetary practices, constitutional and statutory protections, and political discipline. Altogether, these factors can lead to better financial flexibility through enhanced liquidity to weather economic uncertainty and fiscal stress. It is important to note that the economy is a very important factor but insufficient on its own to draw a reliable conclusion on state GO credit quality and its sustainability. A good proxy for how a state government runs its business is the condition of its rainy-day fund (RDF). We view the RDF, while a lagging indicator, as a supplemental “policy optionality” available to state lawmakers. Without a rigorous budgetary process, strong state laws and constitutional framework, rainy day funds would not be replenished in anticipation of the next shock, and without strict transfer requirements, funds could be easily drawn down for any purpose at times when they should not be accessed. Exhibit 6 illustrates the intent behind a state’s RDF during and following the Great Financial Crises. States drew down their balances to mitigate fiscal stress in that period, and structural mechanisms forced the replenishment of the fund. The median RDF as a percentage of state expenditures at its lowest in 2010 was 1.6% (down from 4.8% in 2008) and reached an all-time high in 14.9% in 2024.12
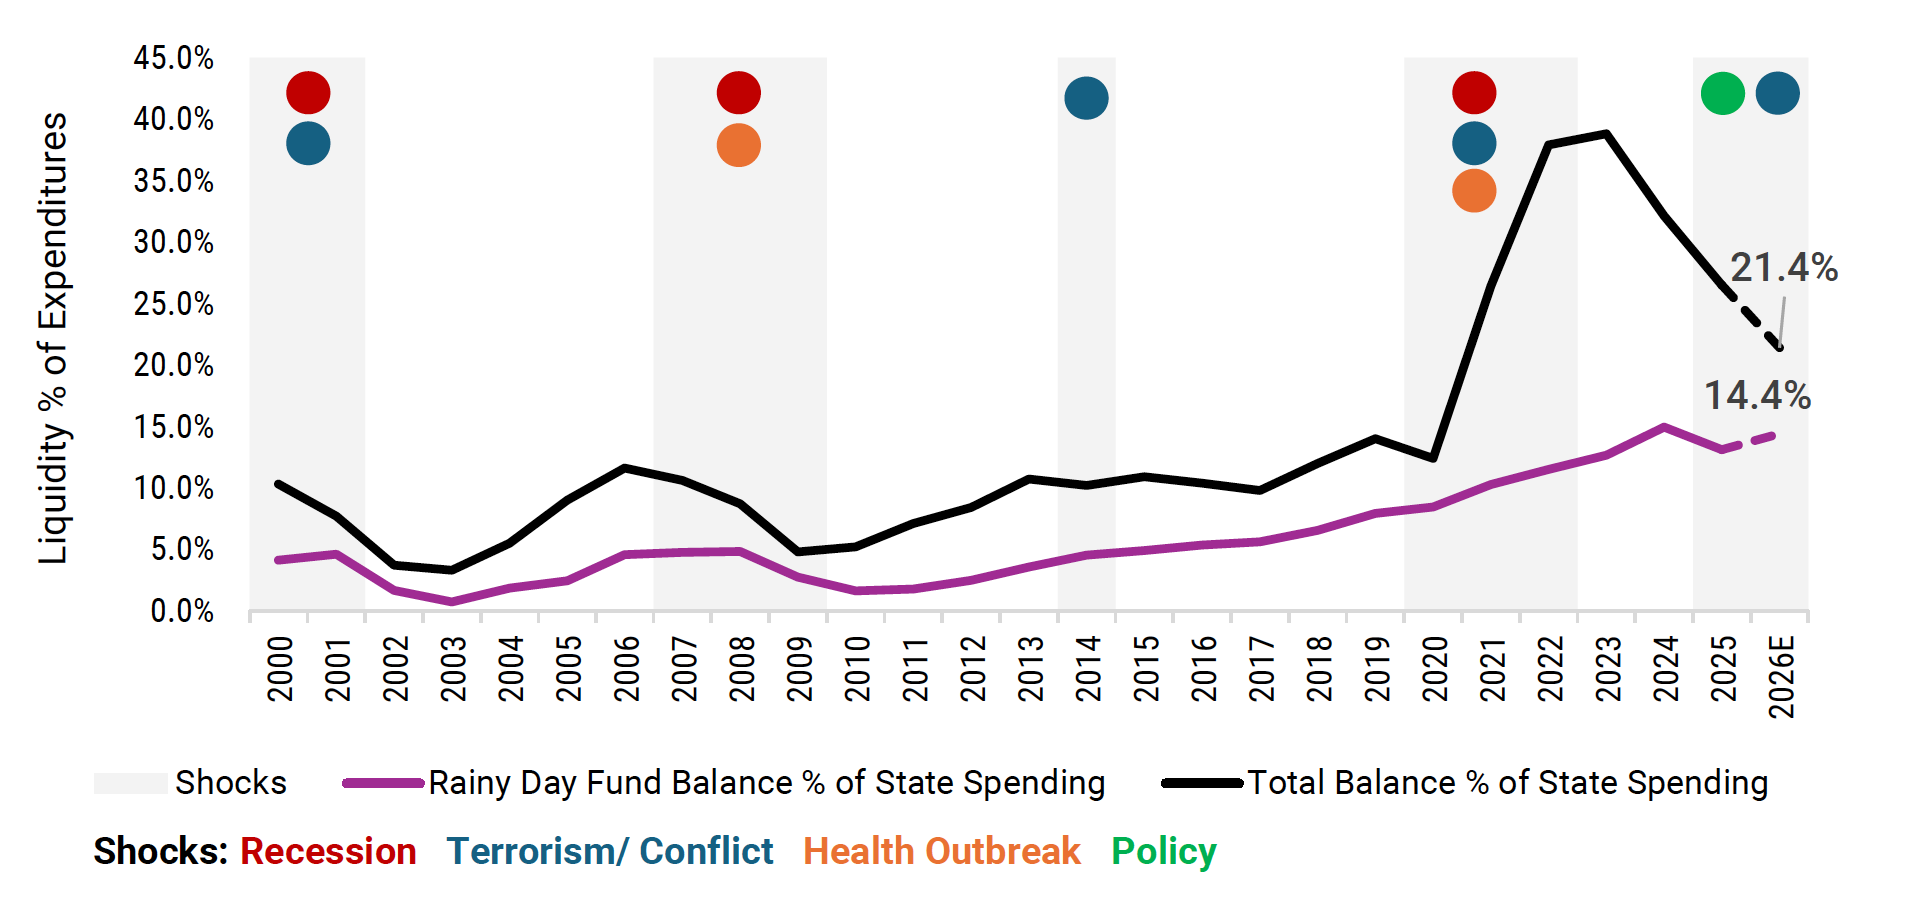
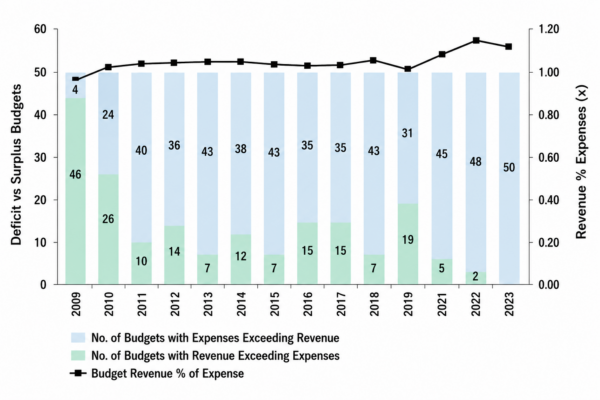
Exhibit 6: State Liquidity Through Time

Source: Pew Research as of December 31st, 2025.

Cash is “king”, and while even the healthiest of RDF balances may not solve credit challenges, it gives state governments the flexibility to get through a downturn, rethink policy (raise revenue, cut spending) and implement an action plan without dysfunction.

A good example is the recent passage of One Big Beautiful Bill Act (OBBBA, H.R.1) in 2025 that introduced $911 billion in federal spending cuts to Medicaid over the next 10 years.13 Most significant changes won’t take effect until 2027 or later,14 and states with good liquidity positions are more likely to smooth out the impact of such cuts without the need for drastic revenue or spending measures. Balanced budgets and the underlying mechanisms to reinforce them indicate the level of state fiscal health as shown in Exhibit 7 below, where the median budget revenue as a percentage of expenses exceeds 1.0x since 2011.15

Exhibit 7: State Budgets (2009-2023)

Source: Pew Research

Overcoming Complacency –Key Takeaways

The municipal landscape continues to evolve as new uncertainties are introduced, and existing stresses are magnified. Our research team maintains that through a rigorous analytical approach and credit selection, we are able to uncover nuances unique to certain credits and identify those that may be best suited to manage through economic, political, and social volatility. The following reasons suggest why GO bonds, both state and local, present durable credit characteristics today:

  • State and local governments have constitutional and statutory frameworks that anchor the likelihood of debt repayment, a quality unique to GOs.
  • Underlying revenue source is in an economic base rather than project/asset revenue.
  • Historical default data suggests that GO bonds are among the most resilient sectors.
  • Proceeds from debt issuance pay for critical infrastructure and social programs, creating an incentive to repay debt and maintain market access.
  • GOs are not created equal and come in different forms defining the quality of the pledge, making credit analysis integral.
  1. 1 State Pension Liabilities Continue to Decline, Improving Leverage Metrics, Moody’s Ratings, September 19, 2025.
  2. 2 Medians – Financial Positions Continue to Improve Post-Pandemic, Moody’s Ratings, May 28, 2025. The Moody’s median data for cities and counties includes fiscal 2023 and preliminary fiscal 2024 data.
  3. 3 State and Local Governments Face Higher Debt, Less Free Cash Flow Amid Capex Catchup, Moody’s Ratings, May 1, 2025.
  4. 4 Credit quality will vary depending on the underlying factors specific to each issuer.
  5. 5 Legal framework varies across states.
  6. 6 US Municipal Bond Default and Recovery Rates (1970-2024), Moody’s Ratings, August 4, 2025.
  7. 7 Ibid.
  8. 8 Ibid.
  9. 9 Ibid.
  10. 10 US Municipal Bonds: Issuance, Trading Volume, Outstanding, Holders, SIFMA, April 1, 2026.
  11. 11 State Ratings data from Bloomberg.
  12. 12 Pew Research Center, www.pew.org
  13. 13 “Medicaid: What to Watch in 2026,” January 23, 2026, www.kff.org
  14. 14 Ibid.
  15. 15 Pew Research Center, www.pew.org

Risks and Other Important Considerations

Not an Offer, Recommendation or Professional Advice: This document does not constitute advice or a recommendation or offer to sell or a solicitation to deal in any security or financial product. It is provided for information purposes only and on the understanding that the recipient has sufficient knowledge and experience to be able to understand and make their own evaluation of the proposals and services described herein, any risks associated therewith and any related legal, tax, accounting or other material considerations. To the extent that the reader has any questions regarding the applicability of any specific issue discussed above to their specific portfolio or situation, prospective investors are encouraged to contact PT Asset Management (PTAM) or consult with the professional advisor of their choosing.

Forward-Looking Statements: Certain information contained herein constitutes “forward-looking statements,” which can be identified by the use of forward-looking terminology such as “may,” “will,” “should,” “expect,” “anticipate,” “project,” “estimate,” “intend,” “continue,” or “believe,” or the negatives thereof or other variations thereon or comparable terminology. Due to various risks and uncertainties, actual events, results or actual performance may differ materially from those reflected or contemplated in such forward-looking statements. Nothing contained herein may be relied upon as a guarantee, promise, assurance or a representation as to the future.

Investing involves risks; principal loss is possible. There is no guarantee that the strategies and services will be successful or outperform other strategies and services. Certain assumptions may have been made in connection with the analysis presented herein, and changes to the assumptions may have a material impact on the analysis or results. The information contained herein has been obtained from sources considered to be reliable, and is subject to change without notice. PT Asset Management, LLC does not guarantee its accuracy, adequacy or completeness and is not responsible for any errors or omissions for the results obtained from the use of such information.

CFA® and Chartered Financial Analyst® are registered trademarks owned by CFA Institute.

PT Asset Management (PTAM) is the advisor to the Performance Trust Funds. Distributed by ALPS Distributors, Inc. © 2026 PT Asset Management, LLC. All Rights Reserved. Investment and Insurance Products: Are not FDIC or any other Government Agency Insured •Are not Bank Guaranteed •May Lose Value.

You are now leaving the PTAM Mutual Funds and ETF webpage and entering the PTAM advisor webpage.

FOR SOPHISTICATED INVESTORS AND FINANCIAL PROFESSIONALS ONLY.

The information contained in the following pages is intended for use by those individuals and institutions that have the resources and financial expertise necessary to independently analyze this information and who have the financial expertise to understand the risks and limitations of these types of presentations. This intended audience includes pension funds, financial intermediaries and professionals, investment consultants, endowments, foundations, and investment advisers.  It is not intended for use by retail investors or retail clients.

By clicking “Accept” below, you expressly acknowledge that you have the resources and financial expertise described above and that you have read, understood and accepted the Terms of Use of the site and the following legal terms and conditions.

The information provided on this website is intended for your viewing only and is not intended for distribution to, or use by, any other person or entity. For information about our privacy policy and practices, please see here.

Find the right Insights for you by selecting the appropriate site:

Financial Professional in the US
Individual Investor in the US

You are now exiting the PT Asset Management, LLC (PTAM) website and entering the HANetf Limited website. HANetf provides services for eligible investors outside of the United States.  Your eligibility for HANetf’s products and services is subject to their investment rules and requirements.