Last month, Taylor put out an excellent article highlighting the importance of building interest rates up protection for investors. I want to highlight a specific line from this article, because we had someone reach out, asking if there was a typo in the piece.
The Quote: “PTIAX has outperformed its benchmark, the Bloomberg US Aggregate (“the Agg”), by 769 basis points (bps) on average in rising rate environments.” (link to the full article here).
You read that correctly – in rising rate environments, PTIAX has, on average, outperformed the Agg by over 7.5%.1 This is NOT a typo! But before I break down HOW this outperformance has come about, I want to pause a moment to think critically about how we should think about “rates up” in fixed income.
When someone says, “I think rates are going up,” then it behooves me to ask them (when proper) these two questions:
- How much do you think rates will rise?
- Over what timeframe will this rate increase occur?
95% of the time, the answer to these questions is – “I’m not sure.” Rightly so!
Without answers to these two questions, we have NO valuable framework to provide us with certainty around where we should invest, besides a vague resistance to “going long.” This gut feeling of aversion to “long bonds” is not helpful to investors, and quite often leads to poor investment decisions.
Shape Management, however, enables us to quantify the risk/reward tradeoff between short and long investments if rates were to rise! Our historic performance is a function of this philosophy. So, let us break this down – how has our Shape Management methodology contributed to our historic outperformance, in rates up?
Consistent Outperformance in Rising Rate Environments
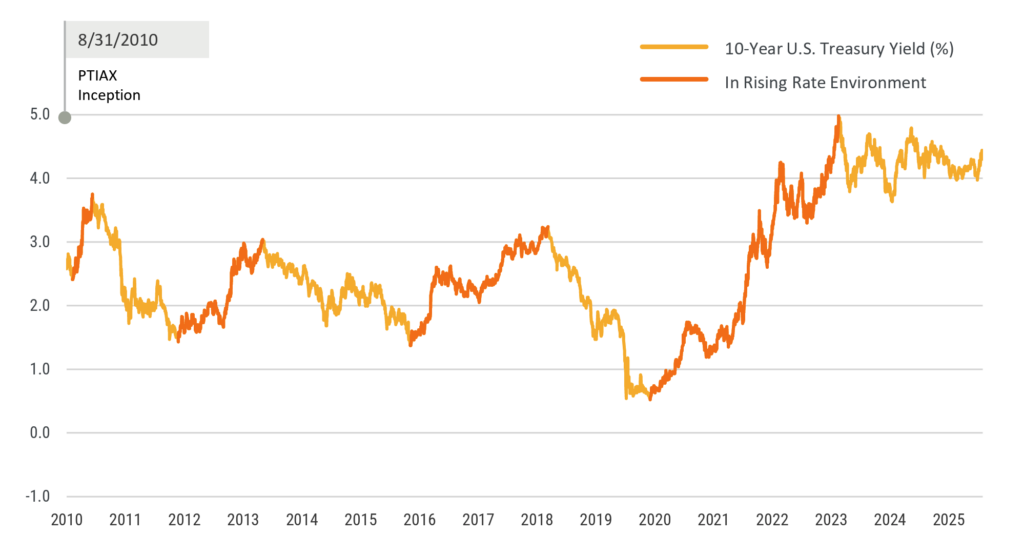
| Total Returns1 in Rising Rate Environments | |||||
| 1st Period (10-7-10---2-8-11) | 2nd Period (7-25-12---12-31-13) | 3rd Period (7-5-16---11-8-18) | 4th Period (8-4-20---10-19-23) | Average | |
| PTIAX | 3.72% | 5.72% | 7.76% | -10.36% | 1.71% |
| Bloomberg US Aggregate Bond Index | -2.96% | -1.71% | -1.89% | -17.38% | -5.98% |
| Intermediate Core-Plus Bond Category Avg. | -1.44% | 1.23% | 0.62% | -14.98% | -3.64% |
| 10-Year Treasury Movements | +134 bps | +161 bps | +187 bps | +446 bps | +232 bps |
Reason 1: Diversification of “Offensive” and “Defensive” Sectors
Shape Management emphasizes the importance of powerful asset combinations. As a result, our portfolios often look like a balance between “Offense,” or interest rate sensitive bonds, and “Defense,” or interest rate in-sensitive bonds. In 2016, for example, we had a large allocation to defensive sectors, particularly heavily discounted non-agency RMBS. Of course, these “Defensive Sectors” were paired with longer Offensive sectors because we did not know what the Fed would do. We bought a strong offensive line AND a strong defensive line – and in 2016, our Defensive line helped us beat the Agg as well as the competition.
Reason 2: Avoidance of inferior cash flow structures
It’s hard to look at any Core-Plus bond fund during the ’20-’23 sell-off without grimacing. But if we look at the losses during that season for PTIAX, the Category, and the Index (“the Agg”), you’ll notice that PTIAX outperformed both by about 5% and 7%, respectively.2 Why? Both the Core-Plus Category, AND the Agg, were heavily weighted in negatively convex Agency MBS. When mortgage rates rose from historic lows in 2020, the risk profiles of these cash flows (which was hidden from investors who relied on yield and duration) extended significantly. This led to unexpected severity in the re-pricing of these assets, for those who didn’t understand the cash flow weakness (negative convexity) inherent in these bonds. We remain underweight in this sector, for the same reason.
Reason 3: Consistency and Discipline
Since 2010, PTAM has run monthly analysis to re-confirm the trade-offs between asset classes, across rate scenarios. This can lead to a fund that can, at first blush, seems inconsistent – in 2016, about half of our fund was invested in RMBS. Ten years later, we own hardly any! Our fund’s consistency is not in which asset classes we own, but rather HOW we decide which cash flows TO own; and we will continue to use this methodology, because it continues to work. For investors that value a disciplined approach towards fixed income investing, PTIAX’s track record speaks for itself – even in rates up scenarios!
1- Source: Morningstar Direct. Based on cumulative total returns.
Returns quoted represent past performance which does not guarantee future results. The investment return and principal value of an investment will fluctuate so that an investor’s shares, when redeemed, may be worth more or less than original cost. Current performance may be lower or higher than the performance quoted. Returns current to the most recent month-end may be obtained at www.test.ptam.com or by calling (866) 792-9606. Returns over one year are annualized. PTIAX Expense Ratio: 0.75%; 30-Day SEC Yield: 4.80%.
Total Returns (as of 3/31/2026)
| 1-Year | 5-Year | 10-Year | Since Inception (8/31/2010) | |
| PTIAX | 4.58% | 1.33% | 3.04% | 4.46% |
| Bloomberg US Aggregate Bond Index | 4.35% | 0.31% | 1.70% | 2.25% |
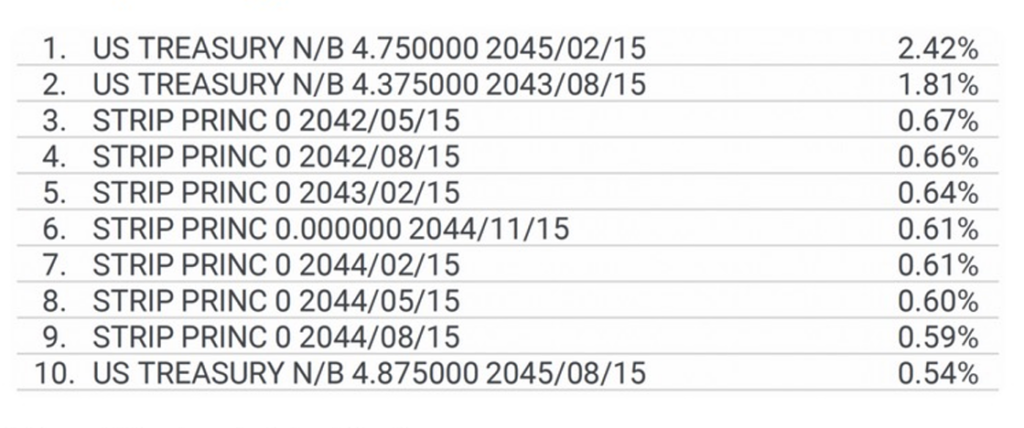
PTIAX Top 10 Holdings(as of 03/31/2026)
Risks and Other Important Considerations
Investing involves risk; principal loss is possible. Investments in debt securities typically decrease in value when interest rates rise. This risk is usually greater for longer-term debt securities. Investments in lower rated and non-rated securities present a greater risk of loss to principal and interest than higherrated securities. Investments in asset-backed and mortgage-backed securities include risks that investors should be aware of such as credit risk, prepayment risk, possible illiquidity and default, as well as increased susceptibility to adverse economic developments. For a complete list of disclosures, please visit www.test.ptam.com.
©2026 Morningstar, Inc. All Rights Reserved. The information contained herein: (1) is proprietary to Morningstar and/or its content providers; (2) may not be copied or distributed; and (3) is not warranted to be accurate, complete or timely. Neither Morningstar nor its content providers are responsible for any damages or losses arising from any use of this information. The Morningstar RatingTM for funds, or “star rating”, is calculated for managed products (including mutual funds, variable annuity and variable life subaccounts, ETFs, closed-end funds, and separate accounts) with at least a 3-year history. ETFs and open-ended mutual funds are considered a single population for comparative purposes. It is calculated based on a Morningstar Risk-Adjusted Return measure that accounts for variation in a managed product’s monthly excess performance, placing more emphasis on downward variations and rewarding consistent performance. The top 10% of products in each product category receive 5 stars, the next 22.5% receive 4 stars, the next 35% receive 3 stars, the next 22.5% receive 2 stars, and the bottom 10% receive 1 star. The Overall Morningstar Rating for a managed product is derived from a weighted average of the performance figures associated with its 3-, 5-, and 10-year (if applicable) Morningstar Rating metrics. The weights are: 100% 3-year rating for 36–59 months of total returns, 60% 5-year rating/40% 3-year rating for 60119 months of total returns, and 50% 10-year rating/30% 5-year rating/20% 3year rating for 120 or more months of total returns. While the 10-year overall star rating formula seems to give the most weight to the 10-year period, the most recent 3-year period actually has the greatest impact because it is included in all three rating periods.
Morningstar Rankings represent a fund’s total return percentile rank relative to all funds in the same Morningstar Category for the same time period. The highest (or most favorable) percentile rank is 1%, and the lowest (or least favorable) percentile rank is 100%. It is based on Morningstar total return, which includes both income and capital gains or losses and is not adjusted for sales charges or redemption feed. Past performance does not guarantee future results.
While PTIAX (Class I) is no-load, management fees and other expenses still apply. Please refer to the prospectus for further details.
The ETF is actively managed and does not seek to replicate the performance of a specified index. The ETF may have a higher portfolio turnover than funds that seek to replicate the performance of an index. Investment and Insurance Products: •Are not FDIC or any other Government Agency Insured •Are not Bank Guaranteed •May Lose Value
© 2026 PT Asset Management, LLC. All Rights Reserved. PT Asset Management, LLC (“PTAM”) is the advisor to the PTAM Funds. Distributed by ALPS Distributors, Inc. PTM000469.
The Fund’s investment objectives, risks, charges and expenses must be considered carefully before investing. The summary and statutory prospectuses contain this and other important information about the investment company, and may be obtained by calling 1.877.738.9095. Read carefully before investing.

Adam is a Client Portfolio Manager with 9 years of experience in fixed income markets. He serves as a liaison between the investment, marketing, and sales teams, leading investment strategy updates, portfolio communications, and market commentary. A previous employee of PTAM’s affiliate company, Performance Trust Capital Partners, Adam specializes in educating investors on complex fixed income asset classes and strategies through the lens of Shape Management. He holds a BA in Business Economics from Wheaton College.
GLOSSARY
Yield Curve refers to the U.S. Treasury yield curve rates.
RISKS AND OTHER IMPORTANT CONSIDERATIONS
Investing involves risk; principal loss is possible. Investments in debt securities typically decrease in value when interestrates rise. This risk is usually greater for longer-term debt securities. Investments in lower rated and non-rated securities present a greater risk of loss to principaland interest than higher-rated securities. Investments in asset-backed and mortgage-backed securities include risks that investors should be aware of such as credit risk, prepayment risk, possible illiquidity and default, as well as increased susceptibility to adverse economic developments. For a complete list of disclosures, please visit www.test.ptam.com.
When selecting a bond to invest in, most investors rely on what we refer to as “traditional fixed income metrics,” which are generally a combination of (1) taking a stance on whether interest rates will increase or decrease, (2) yield and (3) duration. Nearly 30 years ago, PTAM’s founders recognized the potential shortcomings in traditional bond metrics, and developed Shape Management, a math-based investment process that addresses each ofthese shortcomings by analyzing the risk return profile of a bond’s future cash flows. Shape Management is a mathematical calculation that analyzesthe risk return profile of a bond’sor group of bonds’ future cash flows. By using Shape Management, PTAM creates projections of the performance of specific bonds or grouping of bonds. These projections are not the actual performance of any bond or product. As a result, Shape Management performance in this email were not actually achieved by any PTAM investment or product. The criteria and assumptions underlying the projected performance may prove to beincorrect. Prospective investors should not rely solely on such projected performance and should conduct a thorough independent analysis of the investment opportunity. The graphs included throughout this email are provided for illustrative and educational purposes only. Projected performance results mayhave many inherent limitations. No representation is being made that an investment will, or is likely to, achieve profits or losses similar tothose shown. In fact, there are frequently significant differences between projected performance results and actual results subsequently achieved. Although projected performance may be useful to consider when making an investment decision. Investment decisions based on Shape Management information may not be profitable. All projected performance is shown as net performance, which includes management fees, reinvestment of interest payments, principal payments, and capital gains.
The information included is not an offer, recommendation or professional advice. Certain information contained herein has been obtained from third party sources and such information has not been independently verified by PT Asset Management, LLC. No representation, warranty, orundertaking, expressed or implied, is given to the accuracy or completeness of such information by PT Asset Management, LLC or any other person. While such sources are believed to be reliable, PT Asset Management, LLC does not assume any responsibility for the accuracy or completeness of such information. PT Asset Management, LLC does not undertake any obligation to update the information contained herein as of any future date. This email is confidential, is intended only for the person to whom it has been directly provided and under no circumstances may a copy be shown, copied, transmitted or otherwise be given to any person other than the authorized recipient without the prior written consent of PT Asset Management, LLC. Any indices and other financial benchmarks shown are provided for illustrative purposes only, are unmanaged, reflect reinvestment of income and dividends and do not reflect the impact of advisory fees. Investors cannot invest directly in an index. Comparisons to indexes have limitations because indexes have volatility and other material characteristicsthat may differ from a particular hedge fund. For example, a hedge fund may typically hold substantially fewer securities than are contained in an index. Certain information contained herein constitutes “forward-looking statements,” which can be identified by the use offorward-looking terminology such as “may,” “will,” “should,” “expect,” “anticipate,” “project,” “estimate,” “intend,” “continue,” or “believe,” or the negatives thereof or other variations thereon or comparable terminology. Due to various risks and uncertainties, actual events, results or actual performance may differ materially from those reflected or contemplated in such forward-looking statements. Nothing contained herein may be relied upon as a guarantee, promise, assurance or a representation as to the future.
© 2026 PT Asset Management,